

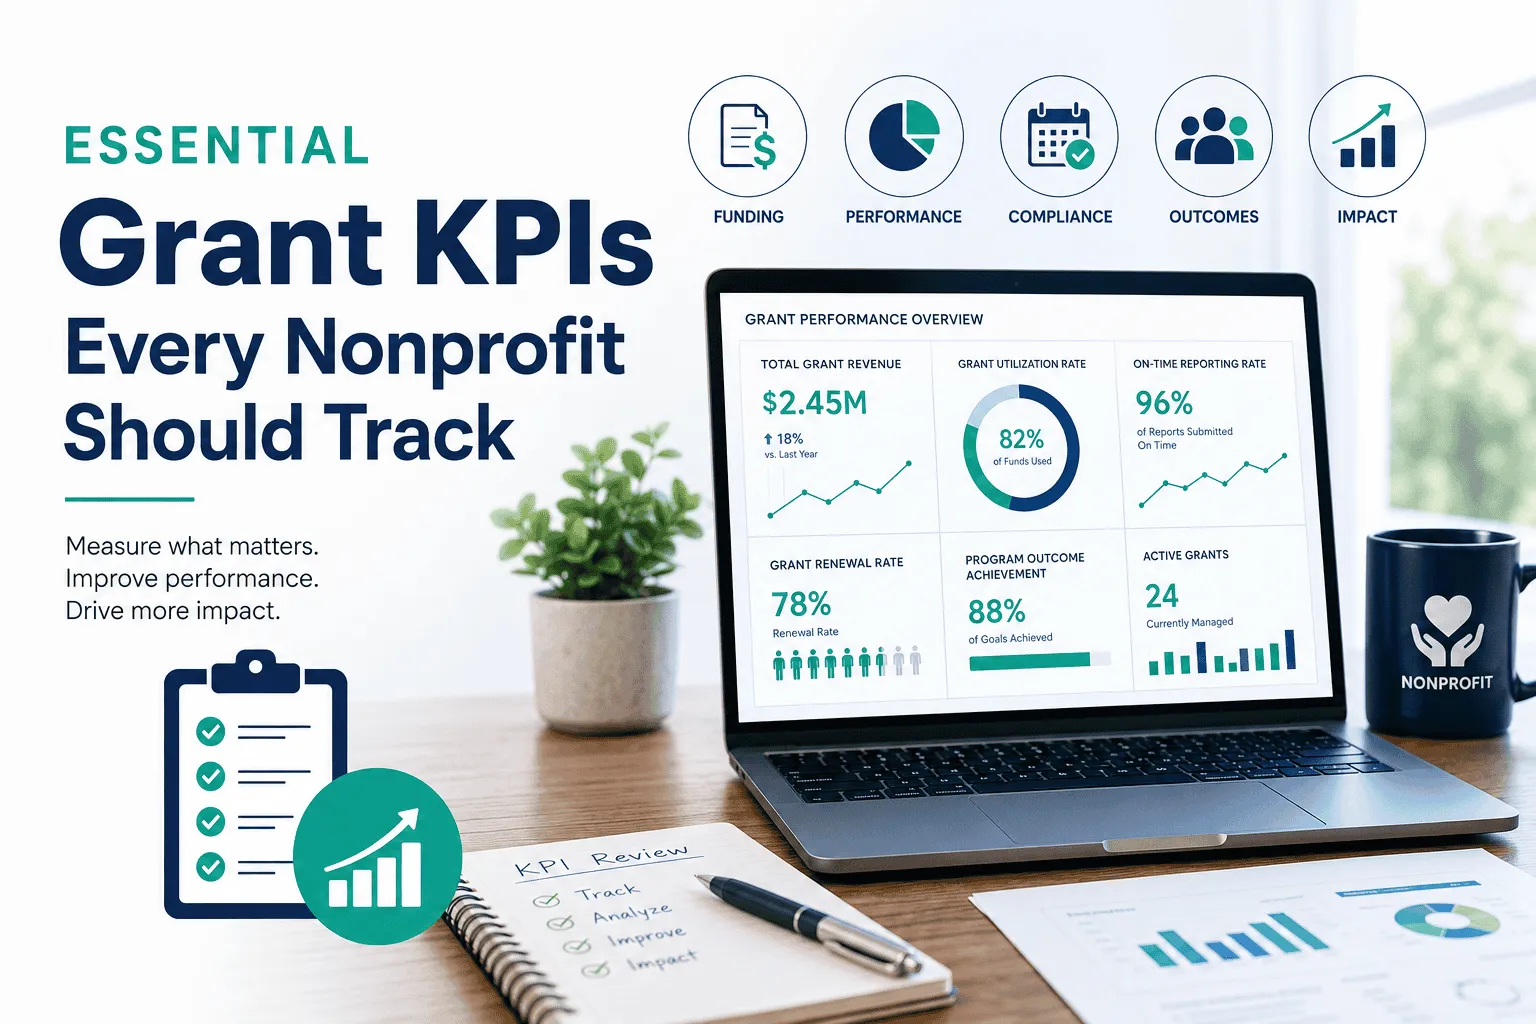
Grant funding is the lifeblood of many nonprofits, supporting everything from program delivery to staffing and capacity building. But securing a grant is only the start. The organizations that consistently win and renew funding are the ones that measure their performance and report on it clearly.
Key performance indicators (KPIs) give you that measurement framework. They turn scattered activity into evidence you can act on and share with funders. Below, we cover why grant KPIs matter, twelve metrics worth tracking, and how to bring them together in a single view.
Why grant KPIs matter
Tracking the right metrics changes how your team operates and how funders perceive you. Well-chosen KPIs help your organization:
- Improve visibility into the health of your grant portfolio
- Strengthen compliance and reporting accuracy
- Allocate staff time and program resources more effectively
- Demonstrate accountability to funders and your board
- Support stronger future applications with documented results
- Identify efficiency gaps before they affect outcomes
When these numbers live in one place and stay current, decisions get faster and conversations with funders get easier.
12 grant KPIs to track
Each metric below includes a simple formula and the reason it deserves attention.
1. Grant application success rate
Awarded applications divided by submitted applications, multiplied by 100. It tells you how effective your application strategy is and where to focus effort.
2. Total grant revenue
The full dollar value of grants secured over a period. This anchors budgeting and shows the scale of your funding base.
3. Grant renewal rate
The percentage of expiring grants that funders renew. High renewal rates signal strong relationships and reliable delivery.
4. Grant compliance rate
The share of grant requirements met on time and in full. Compliance gaps put both current funding and future eligibility at risk.
5. On-time reporting rate
The percentage of reports submitted by their deadlines. Late reports erode funder trust and can delay payments.
6. Funds utilization rate
Funds spent divided by funds awarded. This shows whether you are using awards as intended and on schedule.
7. Cost per grant application
Total application costs divided by the number of applications submitted. It helps you weigh the effort behind each pursuit.
8. Grant ROI
The program value or revenue generated relative to the cost of pursuing and managing the grant. It clarifies which funding streams are worth the work.
9. Program outcome achievement rate
The percentage of stated program goals achieved. Funders care less about activity than about results.
10. Average time to award
The average days from submission to award notification. This supports realistic cash-flow planning.
11. Active grants managed per staff member
The number of active grants divided by grant staff. It reveals whether your team is stretched too thin.
12. Funder retention rate
The percentage of funders who continue supporting you over time. Retention is often more cost-effective than new acquisition.
Building a grant KPI dashboard
Individual metrics are useful, but their value multiplies when they sit together in one real-time view. A dashboard gives leadership, program staff, and finance a shared picture of portfolio health without waiting for a manual report.
Purpose-built grant management software can automate much of this, pulling data from your awards and accounting records so your KPIs stay current. That reduces the spreadsheet maintenance that often makes tracking feel like a burden.
Best practices for grant KPIs
A few habits keep your metrics meaningful over time:
- Define clear ownership so each KPI has a responsible person
- Standardize how data is collected and entered
- Review metrics on a regular cadence, not just at deadlines
- Focus on actionable insights rather than vanity numbers
- Align your KPIs with your organization’s strategic goals
Putting it together
The right grant KPIs help you protect funding you already have and pursue new opportunities with confidence. Start with a handful that map to your biggest priorities, then expand as your reporting matures.
If you want to see how a connected system can keep these metrics current without manual effort, you can request a demo and walk through it with your own scenarios in mind.